
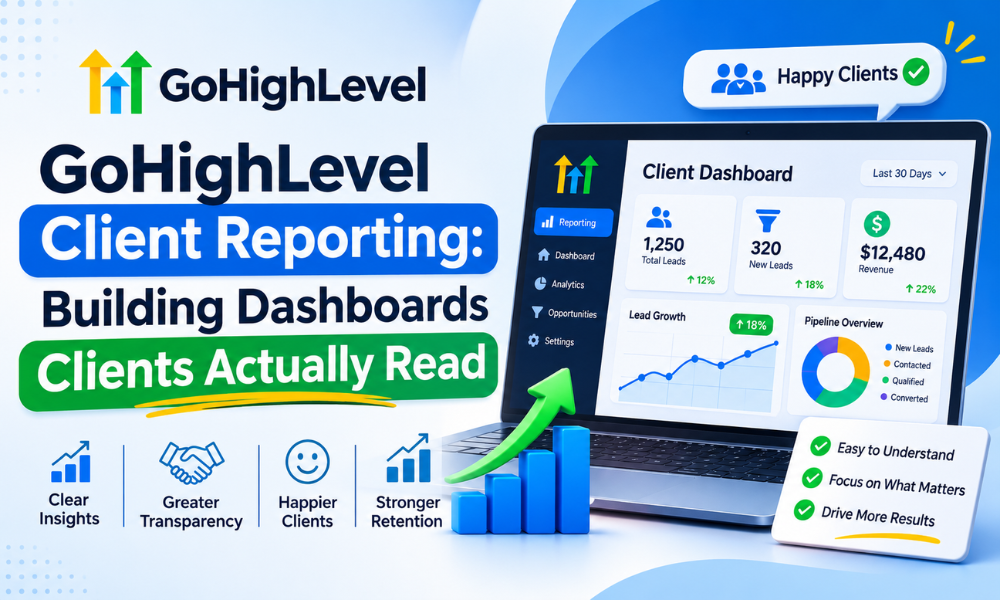
GoHighLevel Client Reporting: Building Dashboards Clients Actually Read
There is a test for any client report, and it is uncomfortable. Stop sending it for two months and see whether anybody asks where it went.
For a surprising number of agencies, nobody asks. The report goes out on the third of the month, gets opened for eleven seconds on a phone, and does nothing. Meanwhile the client forms their opinion of your performance from whether the phone rang last week — which is the same information, measured badly, by somebody with no access to your dashboard.
The problem is almost never the data. GoHighLevel holds plenty. The problem is that most reports are built to demonstrate activity rather than to answer the one question the client is actually asking, which is some version of: is this working, and what are you doing about it?
Why twenty-two metrics is worse than three
The instinct when you are proud of the work is to show all of it. Impressions, reach, clicks, open rates, form views, page time, follower growth. It feels thorough. To the client it reads as noise, and noise has a specific effect: it makes them stop looking for the signal, because they cannot find it.
Worse, a wall of metrics creates a suspicion you did not intend. When somebody cannot tell which number matters, the natural assumption is that the important one is being hidden somewhere in the middle. A report that leads with three numbers, one of which is unflattering, builds more trust than a report with twenty-two that are all fine.
Three is not a magic figure, but it is close to the limit of what somebody holds in their head while reading. Choose three, put them at the top, and let everything else live further down for the rare client who wants it.
Pick the numbers in the client’s language
The single biggest improvement available to most reports costs nothing: translate every headline metric into the words the client uses about their own business.
A dental practice does not think in conversions. It thinks in new patient appointments. A roofing company does not think in opportunities, it thinks in quotes issued and jobs won. A law firm thinks in consultations booked. The underlying GoHighLevel record is the same object in every case — what changes is the label, and the label is what determines whether the number lands.
So the three headline numbers for most service businesses come out as some version of:
- How many new enquiries did we get — the top of the funnel, in whatever unit the client counts.
- How many turned into real business — booked jobs, consultations attended, signed clients. Not “qualified leads”, which is a word that means something different to everybody.
- What did each one cost — total spend divided by the second number. This is the figure that decides whether your contract gets renewed, and it is frequently the one missing.
Everything else is supporting evidence. Useful when questioned, damaging when leading.
A number without a comparison means nothing
“Forty-seven enquiries” is not information. It is a quantity. Information is “forty-seven enquiries, against thirty-nine last month and a target of forty-five”, and the difference between those two sentences is the entire value of the report.
Every headline figure needs at least one comparison and ideally two: the previous period, and either the same period last year or the agreed target. For anything seasonal, the year-ago comparison is the only honest one — a landscaping client whose enquiries fell twenty percent from July to August has not had a bad month, they have had August.
This is also where reports quietly mislead without meaning to. Comparing a 31-day month against a 28-day month, or a month with a bank holiday against one without, produces differences that look like performance and are arithmetic. Put the period length on the report if the months are uneven.

Build it once, run it twenty times
Reporting becomes a problem at scale, not at the start. One client is an hour. Twenty clients, each with a bespoke report somebody assembles by hand, is most of a week every month, and it is the week where nothing else gets done.
The fix is a single template applied to every account, with only the commentary differing. This feels like it should be worse for the client and is almost always better: the metrics are consistent, so comparisons are valid; the layout is familiar, so it reads faster; and you can produce it in fifteen minutes, so it actually goes out on time.
Nothing should be retyped
Any number a human copies from one screen into another will eventually be wrong, and the month it is wrong will be the month a client checks. Pull figures from the source automatically. If something cannot be pulled, that is a reason to reconsider whether it belongs on the report, not a reason to retype it.
This has a prerequisite most accounts skip: the source data has to be trustworthy in the first place. If lead source is not recorded at capture, cost per booking is a guess dressed as a number — the groundwork for which is in GoHighLevel conversion tracking.
The commentary is the actual product
The numbers are the easy part and the part most agencies over-invest in. What makes a report worth reading is a short written verdict: what changed, why you think it changed, and what you are doing next. Three or four sentences, written by the person who runs the account, in plain language.
Clients forward reports with good commentary to their business partners. Nobody has ever forwarded a chart.
The setup that scales
A reporting system that survives twenty accounts has a specific shape, and it is mostly about removing decisions rather than adding capability.
Same three headline metrics everywhere, so nobody chooses per client. A comparison column on every figure, built into the template rather than remembered. Attribution recorded at source so the numbers can be defended when challenged. A commentary box that is empty until somebody fills it, which makes skipping it visible. And a fixed delivery date, because a report that arrives when somebody remembers is a report the client learns to chase.
The quiet benefit of standardisation is comparison across accounts. When every client is measured the same way, you can see which campaigns work across a vertical, which service lines convert, and which accounts are drifting — none of which is visible when every report is bespoke. That cross-account view is where GHL reporting and analytics stops being admin and starts being useful to you rather than only to the client.
What good looks like in numbers
A rough benchmark from accounts where reporting works: three headline numbers, fifteen minutes to produce once templated, a twelve-month comparison window for anything seasonal, and one page before the client stops reading.
That last one is worth taking literally. If the report needs scrolling on a phone, assume the bottom half is unread. Everything that matters goes above the fold, and “everything that matters” is three numbers and a paragraph.
One more figure worth tracking internally: how many clients reply to the report. Not acknowledge — reply, with a question or a decision. A report generating zero replies across twenty accounts is not being read, whatever the open rate says. When we rebuilt reporting for one agency along these lines, replies went from essentially none to roughly a third of accounts responding within a week, and two clients increased spend off the back of a cost-per-booking figure they had simply never been shown before.

The template, section by section
For anyone who would rather copy a structure than design one, this is the layout we use across client accounts. It fits on one page and takes fifteen minutes once the data is wired.
Top: the verdict, in four sentences
Written last, placed first. What happened, why, what you are doing about it, and anything you need from the client. If a client reads nothing else, this is the part that has to stand alone — so write it as though the numbers below were missing.
Then: three numbers, each with a comparison
Enquiries, business won, cost per unit of business won. Each one with last period beside it and the direction marked. No charts yet — a number with a comparison is read faster than any visualisation of the same thing.
Then: the trend, as one chart
A single twelve-month line for the metric the client cares most about. One chart, not six. Its job is to show whether this month is a blip or a direction, which is the question the comparison column cannot answer on its own.
Then: where the business came from
A short breakdown by source, with the proportion you genuinely cannot attribute shown honestly as its own line rather than quietly distributed across the others. This section is the one clients query most, and it depends entirely on whether source is captured at the form — which is GoHighLevel funnel builder groundwork rather than reporting work.
Last: what is happening next month
Three bullets. What you are testing, what you are changing, what you need from them. This converts the report from a backward-looking document into something that sets up the next conversation, and it is the section that generates replies.
Everything else — channel detail, campaign-level breakdowns, the full funnel — goes in an appendix below the fold or in a linked dashboard for the two clients a year who want it. The structure above is deliberately the same for every account, because the uniformity is what makes it possible to run twenty of them. Agencies that outsource GoHighLevel management usually find reporting is the first thing that benefits, precisely because it is templated work that nonetheless needs doing on a fixed date.
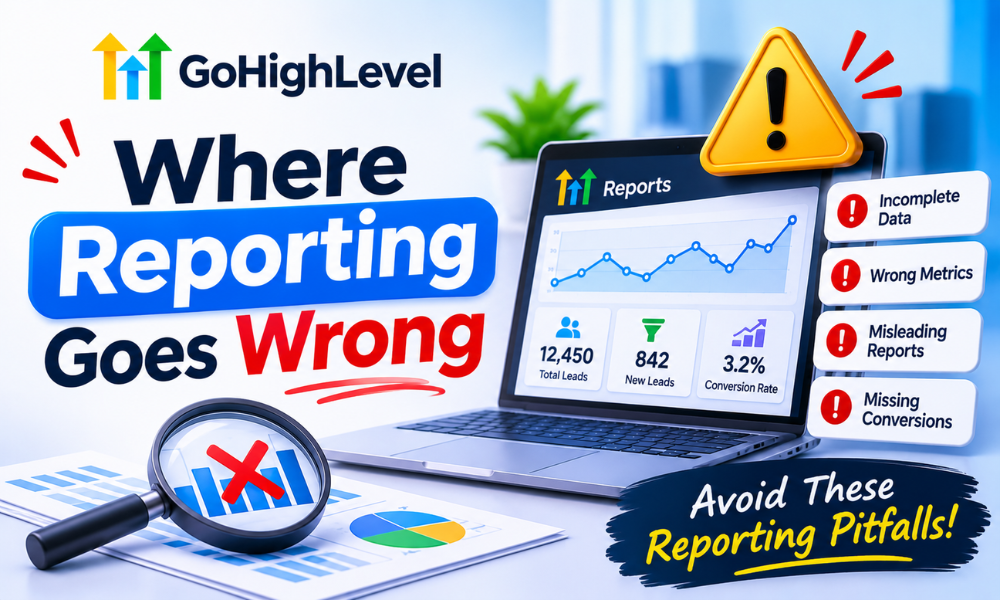
Where reporting goes wrong
Reporting on what is easy to measure. Impressions are easy and meaningless. Revenue attribution is hard and decisive. The pull toward easy metrics is strong precisely because they are always available and always look fine.
Hiding the bad month. Clients forgive a bad month explained before they ask. They do not forgive discovering it themselves. A report that leads with a drop and a plan reads as competence; the same drop found on page four reads as something else.
Changing the metrics when they stop flattering. This is noticed every single time, even when nobody says so. Pick the measures at the start of the engagement, agree them in writing, and keep them.
Letting it become nobody’s job. Monthly reporting is the first thing dropped when a team is busy, and the drop is invisible for about two months before it becomes a renewal conversation. If internal capacity is the real constraint, a trained GoHighLevel virtual assistant producing templated reports on a fixed date costs very little compared with losing an account over silence.
Building a live dashboard and calling it a report. A link the client can check whenever they like sounds better and performs worse. Almost nobody logs in. The report has to arrive, in their inbox, with a human sentence attached.
Frequently asked questions
Monthly or weekly?
Monthly for the formal report. Weekly is too noisy for most service businesses — normal variation looks like a trend and you end up explaining randomness. The exception is a new campaign in its first month, where a short weekly note prevents a nasty surprise at the end.
Should clients have live dashboard access?
Offer it, expect almost nobody to use it, and never let it replace the sent report. The handful who do use it tend to be your most engaged clients, so it is worth providing — just do not count it as reporting.
How do I report when attribution is genuinely unclear?
Say so, in the report, in one sentence, with what you are doing to fix it. Clients handle acknowledged uncertainty far better than confident figures that later turn out to be wrong. An agency that says “about a third of these we cannot source yet, here is the fix” keeps credibility. One that quietly assigns them to the best-performing channel loses it permanently when found out.
What if the client only cares about revenue?
Then lead with revenue and put the rest underneath. The headline metrics should be whatever that specific client makes decisions on. The template keeps the structure consistent; it does not have to keep the top-line metric identical if a client genuinely thinks differently.
Can the whole thing be automated?
The numbers, yes, and they should be. The commentary, no, and attempts to automate it are obvious to read. The realistic target is a report that assembles itself and waits for four sentences from a human before it sends. Wiring that assembly is routine GoHighLevel automation specialist work and usually pays for itself in the first quarter.
Fixing this without rebuilding everything
Take your current report. Delete every metric except three. Add a comparison column to each of those. Write four sentences at the top saying what changed and what you are doing. Send it on the same date next month, and the month after.
That is a thirty-minute change and it will outperform any amount of dashboard engineering, because the problem was never the data. It was that nobody had decided what the report was for.
If reporting has quietly become the job nobody does, that is worth fixing before it becomes a renewal conversation. Book a free GoHighLevel strategy call and we will look at what you currently send, what your clients actually ask about, and where the gap is. Usually it is smaller than people expect.